Dashboard
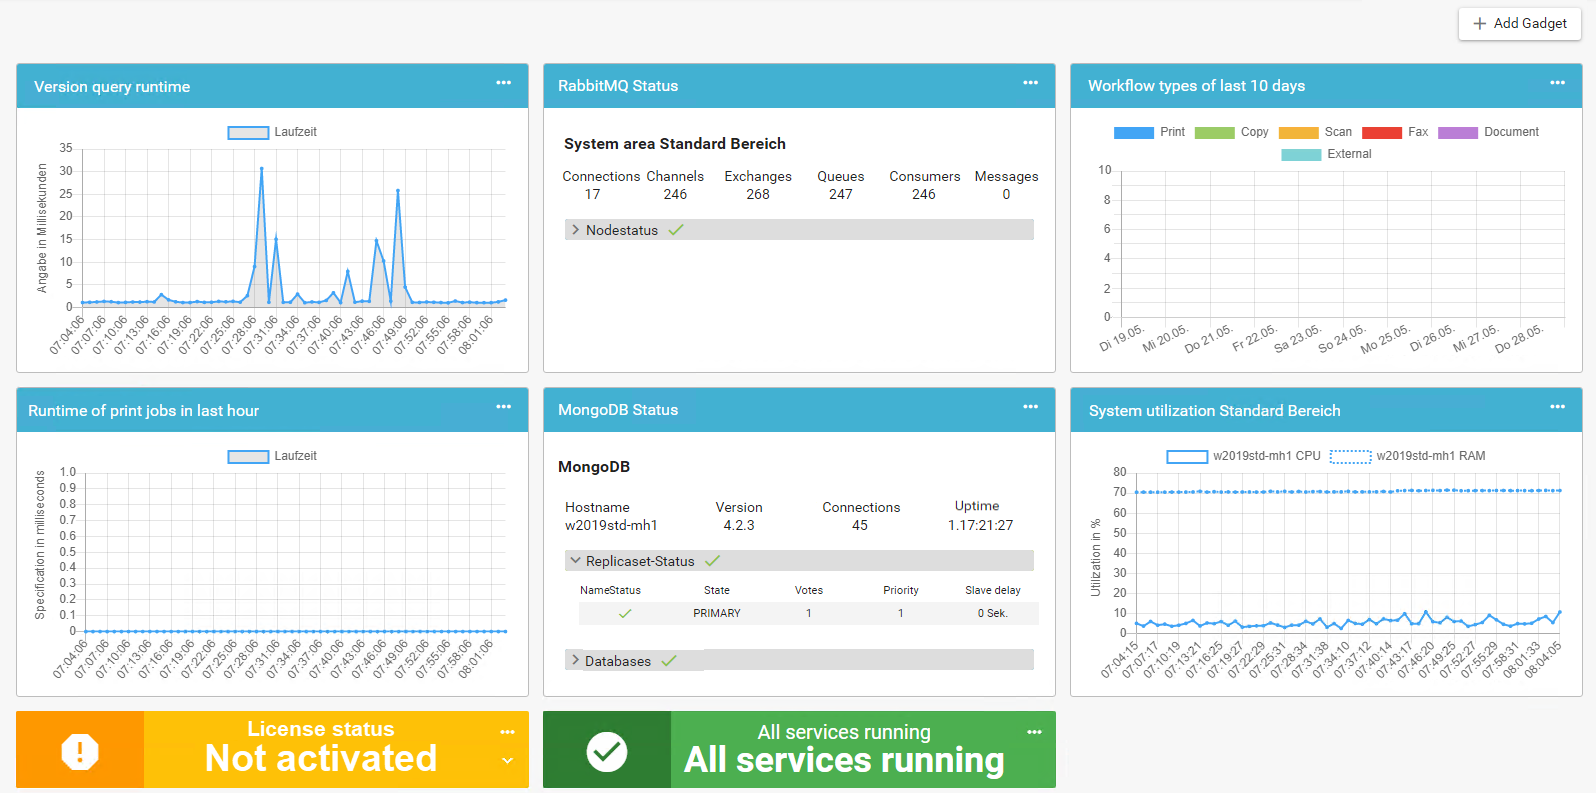
Keep an overview of the IQ4docs system status with the dashboard. It consists of individual gadgets, or tools, which provide an overview of a certain part of the system.
- Running time of print jobs
- States of MongoDB and RabbitMQ
- System load of the Windows system
- State of the services
- and much more.
Gadgets can be added or removed and positioned anywhere in the grid using drag and drop. The Dashboard is the first page you see after the first start of the WebAdmin. It can be reached via the first menu item Dashboard.
The availability of gadgets depends on the role of the logged in administrator, see also Role Management.
Gadgets are divided into the following categories:
 In the chart Workflow types of the last 10 days, the workflows are sorted by type (print, copy, fax...) in a bar. Clicking on the color of the type allows it to be shown or hidden. The data are provided by the WorkflowService.
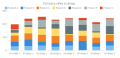
 This gadget displays the workflows of the last 3 hours. You can view the status changes Started, Running, Finished or Error. Clicking on the color of the status allows it to be shown or hidden. The data are provided by the WorkflowService.
 See the System usage standard area gadget for the CPU and RAM utilization of the respective standard area. If the default area is a cluster system, a line for CPU and RAM utilization appears for each cluster node. Clicking on the color of the line description allows it to be shown or hidden.
Clicking on ... and then on Show details allows you to access the System information area, where more information about the system can be read, see also System Information. The data are provided by the ConfigService.
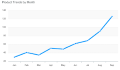 The line chart Runtime of print jobs in last hour shows the runtime of print jobs - this is the time from accepting the print job from the Windows print spooler in the Start module until it passes through the End module (the times of waiting print modules like print jobs such as print@me print jobs are not considered). The data are provided by the PrintService.
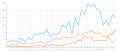
IQ4docs checks the availability of its services performed by the IIS on an ongoing basis. The line chart Runtime of version queries shows the average time of the version queries of all services.
Clicking on ... and then on Show details allows you to access the System information area, where more information about the system can be read, see also System Information. The data are provided by the ConfigService.
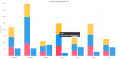
The gadget Device Distribution to Servers shows how many devices are connected to which server. This is especially interesting for very large installations with many servers in order to achieve an even distribution and thus an even utilization of the servers.
Clicking on ... and then on Show details, allows you to access the device list, where you can read more information about the devices, see also Device List. The data are provided by the DeviceService.
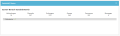
 The colored gadget Overview of Services allows you to see immediately if something is wrong with one of the services. In this case, the gadget is displayed in red and how many of the services are not running is shown. Expand the gadget with the down arrow
  and find out which services have a problem.
Clicking on ... and then on Show details allows you to access the Service Status area, where more information about the system can be read, see also Service Status. The data are provided by the ConfigService.
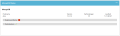
The colored gadget status of the license shows if your license has expired (red), is not activated (orange) or is activated and valid (green). Expand the gadget with the down arrow and view the details of the license. These and other license details can be obtained by clicking on ... and then on Show details to access the License overview, see also Licensing.
The data are provided by the DeviceService.
 The gadget RabbitMQ Status gives you an overview of the status of the RabbitMQ instances. If there are several system areas in the IQ4docs installation, they are displayed in blocks one below the other. If the system area is designed as a cluster, there are several RabbitMQ installations (nodes). These are displayed one below the other in the node status area. The data are provided by the ConfigService.
The RabbitMQ instance per system area contains the following information (this can only be displayed if the node status is OK  ). The quantities are displayed for:
- Connections: TCP (AMQP) connection to the RabbitMQ; a constantly increasing number of connections may indicate problems.
- Channels: One or more channels can exist per connection.
- Exchanges: An exchanger distributes messages to queues. There can't be more exchangers than queues.
- Queues: A queue contains messages. Messages are created by a service or a device and processed by a consumer (a processing component, usually a service).
- Consumers: A consumer processes the messages in a queue. If there are considerably more queues than consumers, this indicates that there are queues without consumers. The messages in a queue without a consumer are therefore never processed - this indicates that the system is malfunctioning.
- Messages: Only very few messages should be present in the system, ideally 0 (idle state of the system). A high or constantly increasing number of messages indicates that messages are accumulating and not being processed correctly (queues without consumers may exist).
The node status allows the state of the (cluster) nodes of a RabbitMQ instance to be viewed (a single-server installation has only one node).
-
The RabbitMQ node is running normally.
-
 The RabbitMQ node is not reachable.
 -
 The RabbitMQ node might not be configured correctly.
Additionally, the versions of RabbitMQ and Erlang are displayed. It is essential that these versions all be the same for all nodes.
In an installation with several databases, the system might be designed in such a way that not all areas can reach each other via the network. In this case, use this gadget instead of the gadget Overview of RabbitMQ (all areas). The description of the gadget settings can be found in the description of the gadget Overview of RabbitMQ (all areas).
 Get an overview of the state of MongoDB with the gadget MongoDB-Status. The data are provided by the ConfigService.
- Hostname:
- Version: Version of the database
- Connections: Number of connections to the database (IQ4docs components open connections to the database)
- Running time: Time that has elapsed since the last database restart
The replica set uses the status icon to indicate whether everything is OK with the cluster.
- Name: Hostname of the MongoDB cluster node
- Status: Status icon
- State: PRIMARY or SECONDARY. Only one node is PRIMARY.
- Votes: Indicates whether the cluster node can be elected as PRIMARY (1) or not (0). The normal state for all cluster nodes is 1.
- Priority: Specifies the priority with which cluster nodes are elected as PRIMARY. By default, all cluster nodes have equal rights and therefore have the same priority.
- Slave delay: Indicates whether a cluster node is synchronized with a delay. By default, there are no delayed nodes in a IQ4docs cluster, so all the values are at 0.
Shows whether everything is OK with the databases inside MongoDB.
- Name: Name of the database (Workflow contains all IQ4docs data except DB Logging, Logging contains logging data).
- Status: Status of the database, everything is OK.
- Collections: Number of collections (in a document-based database, a collection is essentially a table).
- Objects: Number of objects (an object can be understood as a data record).
- Data volume: Total size of the uncompressed data in the database.
- Storage size: Total amount of memory used for the database on the hard drive (the StorageEngine can work with compression).
Add a gadget using the + Add Gadget button. In the selection, the gadgets are divided into categories. You can also search for a gadget using the search field. If you want to add a gadget to the dashboard click on Add. The gadget is automatically positioned at the last position. On the Dashboard, after clicking the gadget, keep the mouse button held down and drag the gadget to the desired location.
To remove a gadget, click on ... in the upper right corner of the gadget and select Delete from the menu. Here you can also exchange the gadget for another or refresh the data in it.